In the field of project management, effective planning, monitoring, and control are crucial for successful project outcomes.
Two commonly used tools for visualizing project progress and managing project timelines are the S Curve and the Gantt Chart. While they serve similar purposes, these tools have distinct differences in their approach, presentation, and application.
Understanding the differences between the S Curve and Gantt Chart is essential for project managers to choose the right tool for their specific needs.
This article explores the differences, advantages, and use cases of the S Curve and Gantt Chart in project management.
Contents
The S Curve
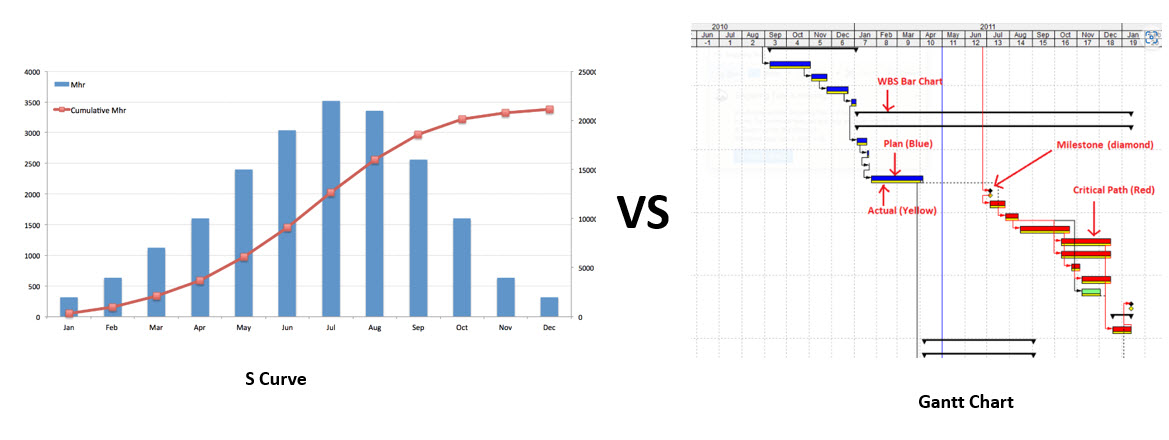
The S Curve is a graphical representation of project progress over time. It is named after its characteristic shape resembling the letter “S”.
The S Curve provides a visual representation of planned versus actual progress, allowing project managers to analyze performance trends, forecast project completion, and identify potential deviations.
The S Curve focuses on the overall project progress rather than the detailed tasks and dependencies.
The Gantt Chart

The Gantt Chart is a bar chart that represents the tasks assigned to the project, their beginning and ending dates, and dependencies. It provides a detailed view of the project schedule, allowing project managers to plan, schedule, and track individual tasks.
The Gantt Chart helps in identifying project timeline, critical path activities, managing resource allocation, and ensuring task dependencies are properly aligned.
Differences between S Curve and Gantt Chart
Presentation: The S Curve presents project progress as a curve, while the Gantt Chart presents tasks and their timelines in a bar chart format.
Focus: The S Curve emphasizes performance analysis and forecasting, while the Gantt Chart focuses on task scheduling, dependencies, and resource allocation.
Level of Detail: The S Curve provides an overall view of project progress, while the Gantt Chart offers a detailed breakdown of individual tasks and their relationships.
Forecasting: The S Curve enables forecasting project completion based on performance trends, while the Gantt Chart primarily supports schedule planning and tracking.
Analysis: The S Curve allows project managers to identify performance deviations and trends, while the Gantt Chart helps in tracking task progress, dependencies, schedule and critical path activities.
Advantages of the S Curve
Performance Analysis: The S Curve enables project managers to analyze project performance trends and identify potential issues early on.
Forecasting: With the S Curve, project managers can forecast project completion dates and cost estimates based on the project’s performance trajectory.
Visual Representation: The S Curve provides a visual representation of project progress, making it easier to communicate project status to stakeholders.
Proactive Decision-making: By analyzing the S Curve, project managers can make informed decisions and take proactive actions to keep the project on track.
Advantages of the Gantt Chart
Task Management: The Gantt Chart helps project managers in planning, scheduling, and tracking individual tasks, ensuring timely completion.
Dependencies: The Gantt Chart displays task dependencies, allowing project managers to understand the critical path and ensure tasks are sequenced correctly.
Resource Allocation: With the Gantt Chart, project managers can allocate resources effectively by visualizing resource requirements and availability.
Progress Tracking: The Gantt Chart provides a visual representation of task progress, enabling project managers to track project milestones and identify delays.
Cases and Scenarios
Use Case 1: When stakeholders need a comprehensive perspective on progress and performance analysis, the S Curve proves to be a more fitting choice.
Use Case 2: For stakeholders requiring project information encompassing intricate task dependencies, resource allocation, and detailed scheduling, the Gantt Chart emerges as the more suitable option.
Use Case 3: Both tools can be used together, with the S Curve providing an overall view and the Gantt Chart offering a detailed task-level analysis.
Conclusion
The S Curve and Gantt Chart are valuable tools in project management, each serving different purposes and offering distinct advantages.
While the S Curve focuses on overall project progress and performance analysis, the Gantt Chart provides a detailed task-level view for planning and tracking (physical progress and timeline).
Project managers can combine the use of both, depending on needs.
Understanding the differences and advantages of the S Curve and Gantt Chart will enable project managers to effectively plan, monitor, and control their projects, leading to successful project outcomes.

Penulis berkomitmen untuk terus berbagi pengetahuannya dengan komunitas melalui blog tutorialnya.
Tujuannya adalah untuk membantu pembaca meningkatkan efisiensi, produktivitas, dan keberhasilan dalam proyek-proyek dengan memanfaatkan alat-alat perangkat lunak yang telah terbukti efektif.
Dengan cara ini, Penulis berharap dapat memberikan kontribusi positif bagi perkembangan karir dan kesuksesan profesional pembacanya di bidang manajemen proyek.
- Melacak Revisi Teks, Gambar atau Objek di Dokumen Word – May 3, 2024
- Mengoreksi Kesalahan Penulisan Secara Otomatis di Word – May 3, 2024
- Menggunakan Navigation Pane untuk Menelusuri Dokumen – May 3, 2024
